Most physicians can tell you exactly how many patients they saw today.
Far fewer can tell you whether their practice is actually becoming more profitable over the years. They just look at if they are bringing in more money each year. But being busy and bringing in more income doesn’t always mean you are becoming more profitable.
The truth is that many practice owners are working harder than ever without knowing the numbers that drive the health of their business.
If you only track five metrics each month, make them these.
1. Total Revenue
This may seem obvious, but revenue is your practice’s scoreboard.
Track your total monthly revenue and compare it to prior months and prior years. Revenue trends help you quickly identify whether your practice is growing, plateauing, or declining.
Ask yourself:
- Is revenue increasing year over year?
- Are there seasonal trends?
- Which services generate the most revenue? (This doesn’t necessarily mean the ones that bring in the most money).
2. New Patients
New patients are the lifeblood of most medical practices. Without a steady flow of new patients, growth becomes difficult and revenue eventually stalls.
Tracking new patients helps you understand whether your marketing, referral relationships, and online presence are working.
Ask yourself:
- How many new patients did we see this month?
- Is the number increasing or decreasing?
- Where are these new patients coming from?
- Where are our best patients coming from?
3. No-Show and Cancellation Rate
This is one of the most overlooked metrics in healthcare. Every missed appointment represents lost revenue and wasted provider time. Many practices don’t realize how much no-shows are costing them until they calculate the number.
Ask yourself:
- What percentage of appointments are no-shows?
- Is the rate increasing?
- Are certain providers or appointment types more affected?
Do the math so you can see how much you are losing each month due to no-shows. (For this you need to know the average revenue per patient visit, which is the next KPI to know.) Even a small reduction in no-shows can have a significant impact on revenue.
4. Average Revenue Per Patient Visit
Not all patient visits generate the same value. Tracking average revenue per visit helps you understand whether you’re maximizing opportunities within your practice.
This metric can reveal:
- Undercoding
- Inefficient scheduling
- Missed ancillary service opportunities
- Changes in payer mix
Ask yourself:
- What is our average revenue per visit?
- Is it increasing or decreasing?
- What is each provider’s average revenue per patient?
5. Net Collection Rate
Your net collection rate measures how much of the money you’re entitled to collect actually makes it into your bank account.
A low collection rate can indicate:
- Billing issues
- High denial rate
- Inefficient follow-up
- Contracting problems
- Low collection rate for patient’s copays and deductibles
For most practices, this is one of the fastest ways to uncover hidden revenue leaks.
Ask yourself:
- What is our net collection rate?
- Is it improving month-t0-month?
- How does it compare to industry benchmarks?
You don’t need dozens of reports to understand your practice.
Start with these five KPIs:
✔ Total Revenue
✔ New Patients
✔ No-Show Rate
✔ Average Revenue Per Visit
✔ Net Collection Rate
If you know these numbers every month, you’ll make better decisions, identify problems sooner, and gain a clearer picture of your practice’s financial health.
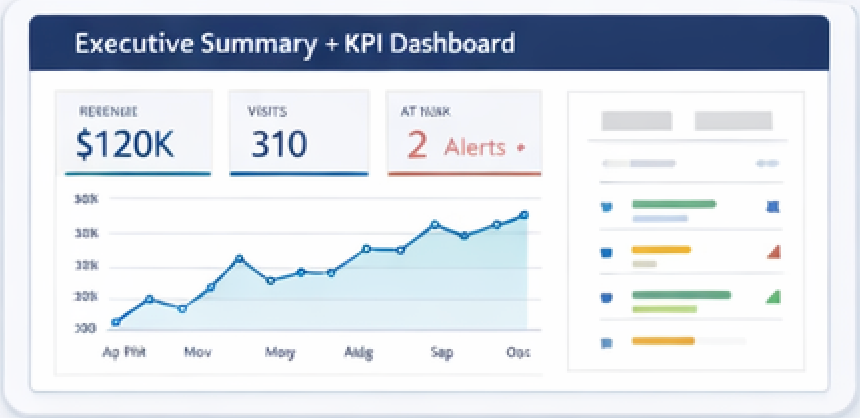
That’s exactly why we created the BSP Practice Intelligence™ KPI Dashboard. It gives physicians a simple way to track the numbers that matter most without spending hours digging through reports.
Don’t want to track these yourself? Our KPI Dashboard does it for you every month for $149. https://businesssavvyphysician.com/kpi-dashboard/